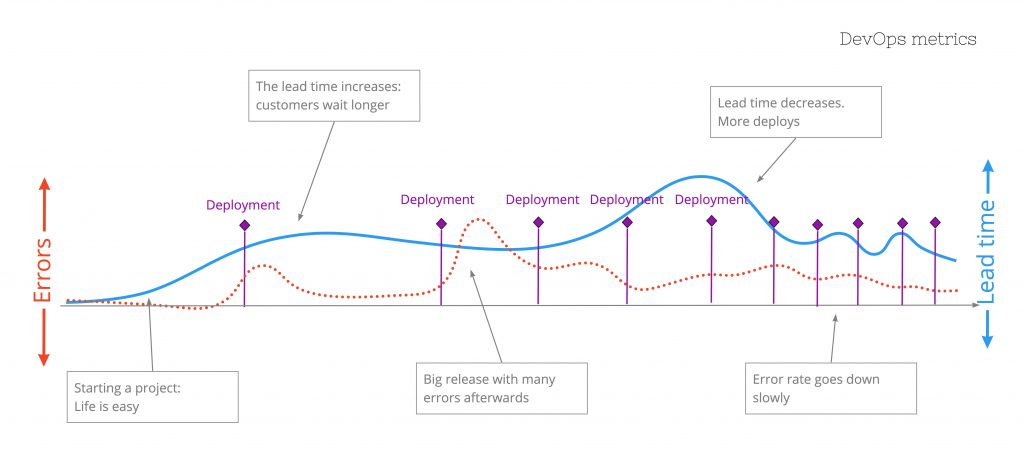
In regards to the quality of both software products as devops processes there are four main metrics that can be considered to be leading:
- Mean Lead Time for changes (MLT) – lower is better,
- Mean Time To Recover (MTTR) – lower is better,
- Deployment Frequency (DF) – higher is better,
- Change Failure Rate (CFR) – lower is better.
One thing at a time
With these metrics as a way to monitor our current status, trends and ways to uncover the underlying bottlenecks there is no big change program, agile scaling or devops revival campaign needed.
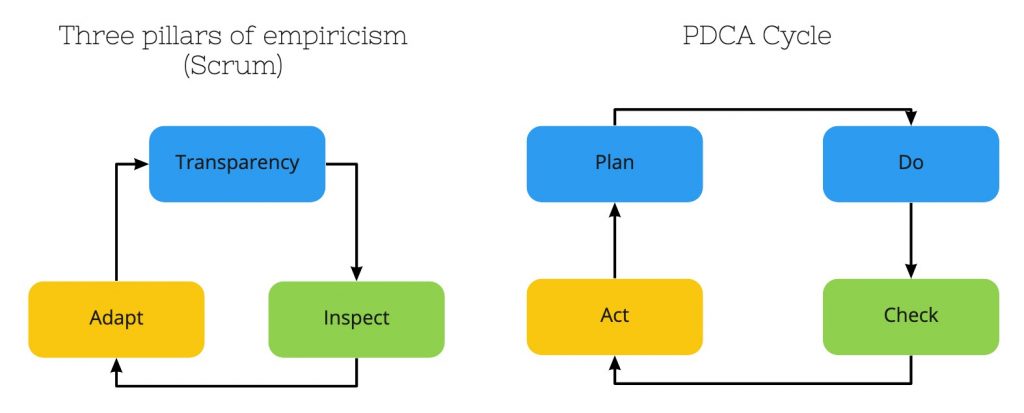
If done properly the essence of scrum (three pillars of empiricism) and the plan–do–check–adjust cycle are being followed perfectly. If done right the focus will be on the biggest bottleneck and on that one only.

Flow
If we regard the whole process from idea to production we try to create value for end users. If we take a look at the first two metrics we see these are time/flow related:
- Mean Lead Time for changes (MLT): how fast does an idea go to production?
- Mean Time To Recover (MTTR): how fast can we repair if there are failures?
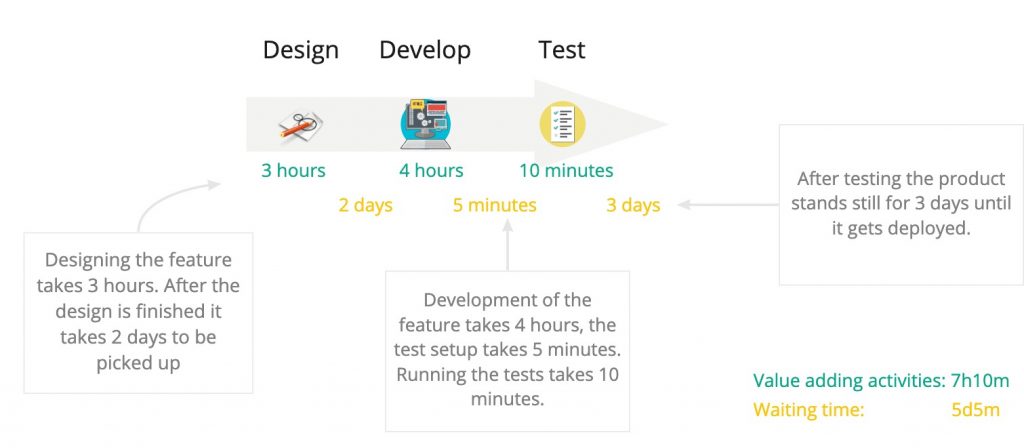
These can be easily and quickly be analysed by simple techniques like value stream mapping:

Or slightly zoomed in and explained:

While creating a value stream map we will take a close look at both the value adding times and the non-value adding times we also call waiting times. If there is much waiting time, this means the flow of getting ideas to production is not optimal and these steps should be analysed.
Most common bottlenecks regards to flow:
- Company applied restrictions: teams are not allowed to deploy themselves, teams need to follow manual processes of approval, security officers not approachable.
- Process: unclear business objectives so teams have a hard time understanding the main purpose, mostly individuals working solo, absence of code review/pairing, no focus on flow.
- Quality: lack of test automation, continuous integration and deployment, absence of coding standards.
- Knowledge: no proper junior/medior/senior balance, no knowledge sharing.
How often and how good
In the value stream map we already see some data about the next metric: Deployment Frequency. We can see if deployments are a bottleneck in regards to the time it takes and the waiting time before and after.
One of the reasons we implement continuous integration and delivery is because fast feedback is key. So the sooner we have proof that things behave the way they should on production the better we can sleep at night.
There is no magic number that applies for every application/company. We should just determine how often we think we should go to acceptance and production. It is strongly related to what your customers need and in which business you operate but from a technical and flow perspective the more often the better.
Most common issues in regards to a low Deployment frequency:
- Company applied restrictions: teams are not allowed to deploy themselves, teams need to follow manual processes of approval.
- Architectural: the software can’t be independently deployed/too much dependencies.
- Infrastructural: Very complicated infra which makes the process slow and unpredictable.
- No demand from the business: there is no sense of urgency and no one needs the software soon.
The last thing we need to closely monitor is the Change Failure Rate. It will tell us how often we have bugs/issues after we have deployed.
Most common issues in regards to a high Change Failure Rate:
- Environments: difference between test and production environment so bugs will appear on only one.
- Lack of extensive automated testing: no automated tests, integration tests, mutation tests will result in unpredictable quality.
- Manual infra configurations: no infra as code/immutable infra which makes changes error prone.
- The lack of proper test data management/test db provisioning: always testing with a predictable testset instead of real world data.

Like many things, when you regard them holistically: fixing the biggest issue will often resolve or improve one or more others. So rather than making this really big and trying to get all the data automatically in a dashboard, just start with a value stream map which will tell you how fast you currently get ideas to end users.
Sometimes you find out that there is no traceability between ideas, the code and deploys. Well there is your first item to solve. You would never be able to tell how you are doing without it anyway. Maybe the backlogs are full of items that haven’t changed for months or even years. There is your next item: waiting times of months. Try to change more to a just-in-time way of working.
Often you just have to take a step back before you can go forward in software development.
